
Anchor Charts – Good Teaching at ALL Levels
When I talk to teachers about anchor charts and the need for them in the classroom, I tend to get one of two reactions: 1) faces light up eagerly with that ”I can’t wait to get to it” look or 2) faces crumple and the teachers groan.
The negative reactions tend to come from teachers who feel that they’re “not artistic” and the charts will be a terrible ordeal to produce. The more artistically talented teachers feel less intimidated. But both these responses come from a general misconception of what an anchor chart is and why it should be used.
Anchor charts are not works of art. They’re visuals meant to help support the learner and the more they’re made with the learner, the more effective they are.
Why do we use anchor charts?
Anchor charts provide scaffolding for our students, reminding them of the learning that’s going on in the classroom. They document the thinking that the students have done as they reach understanding and they show thinking over time. Often anchor charts are developed over a series of lesson and students will add to them as they find information. When conferencing with a student, it’s wonderful to be able to point to a chart and say, “remember what we said about….”
Building anchor charts:
• anchor charts should be made with your students. They’re only meaningful to students if they’ve collaborated in creating them.
• when planning a mini-lesson consider how you’ll present the information in a chart. You can make an outline of the chart (often an empty graphic organizer with a title) and then fill it in during the lesson.
• anchor charts are often open-ended: teachers and students can add to them as the learning continues.
• anchor charts are specific to the learning going on in your classroom. Look online or visit other classrooms for ideas, but make your chart specific to your own teaching.
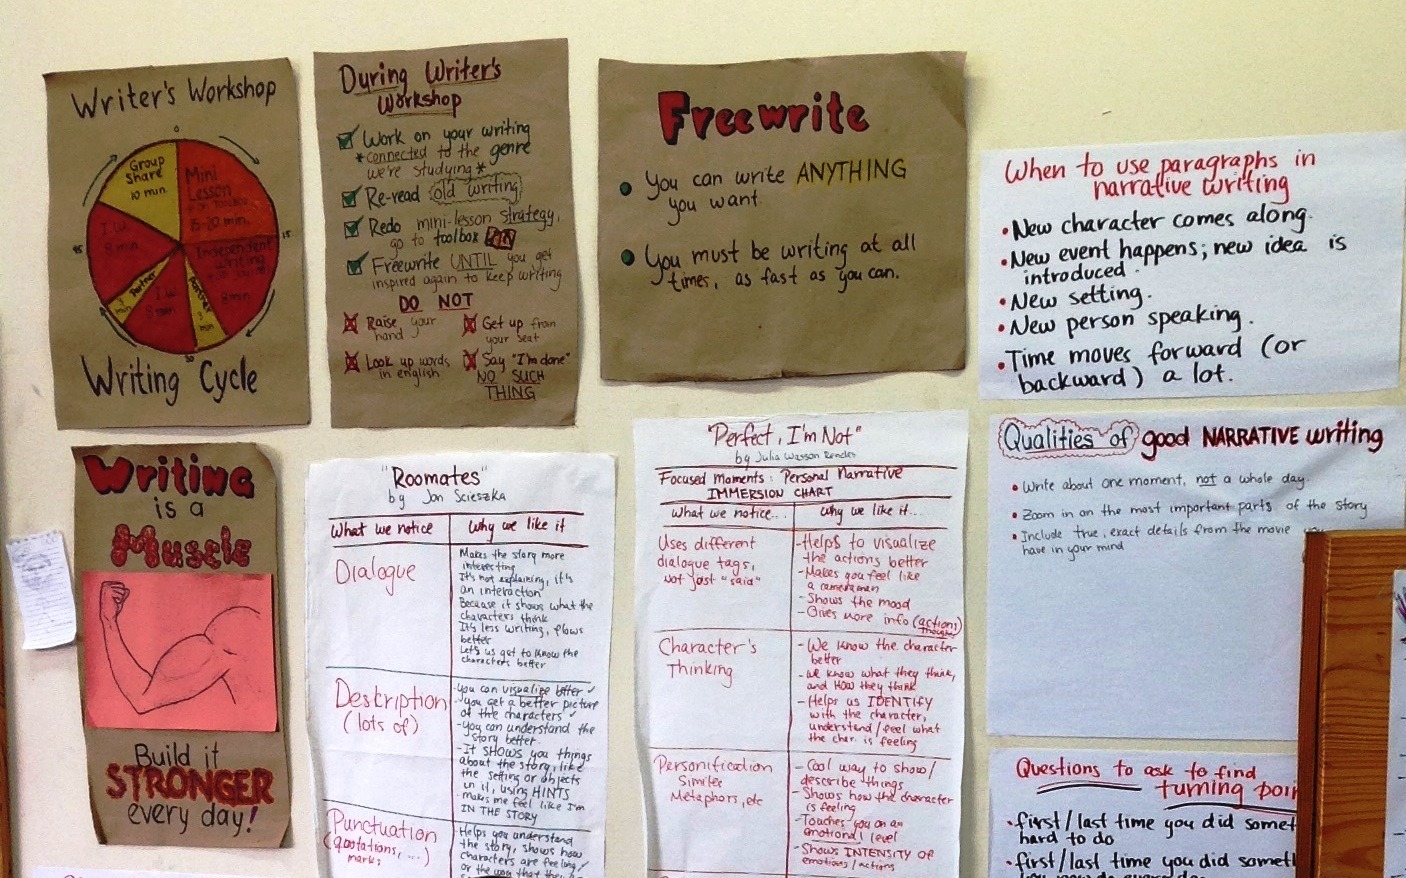
A few examples:
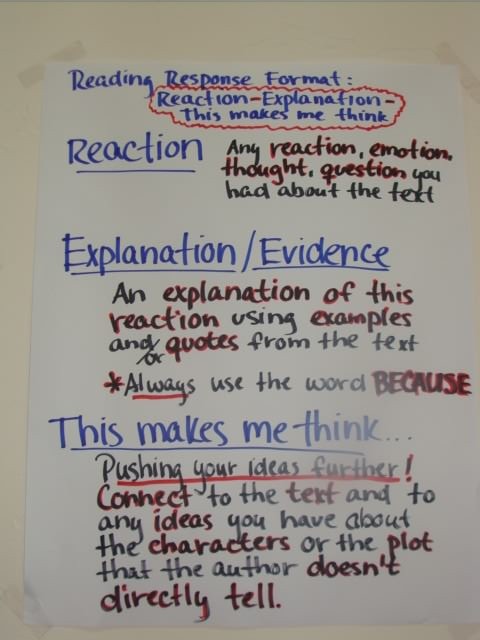
Frank’s 6th grade reading response format chart
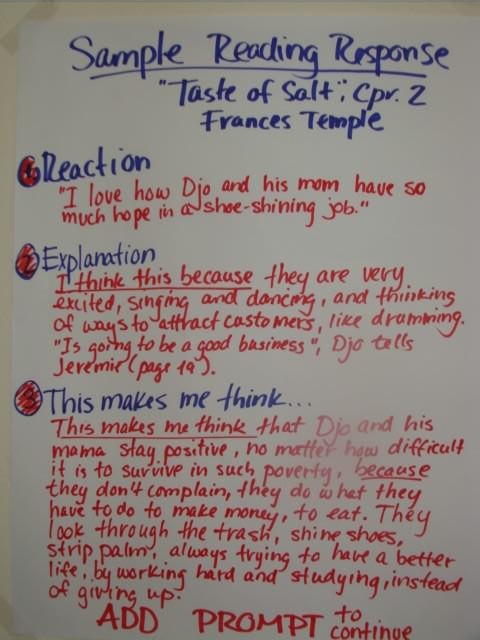
Frank’s 6th grade sample reading response
To the left is a reading response format, explaining the teacher’s expectations to the students.
To the right is the teacher’s model of a reading response. Thinking aloud the teacher writes his or her response, allowing students to see what’s expected of them.
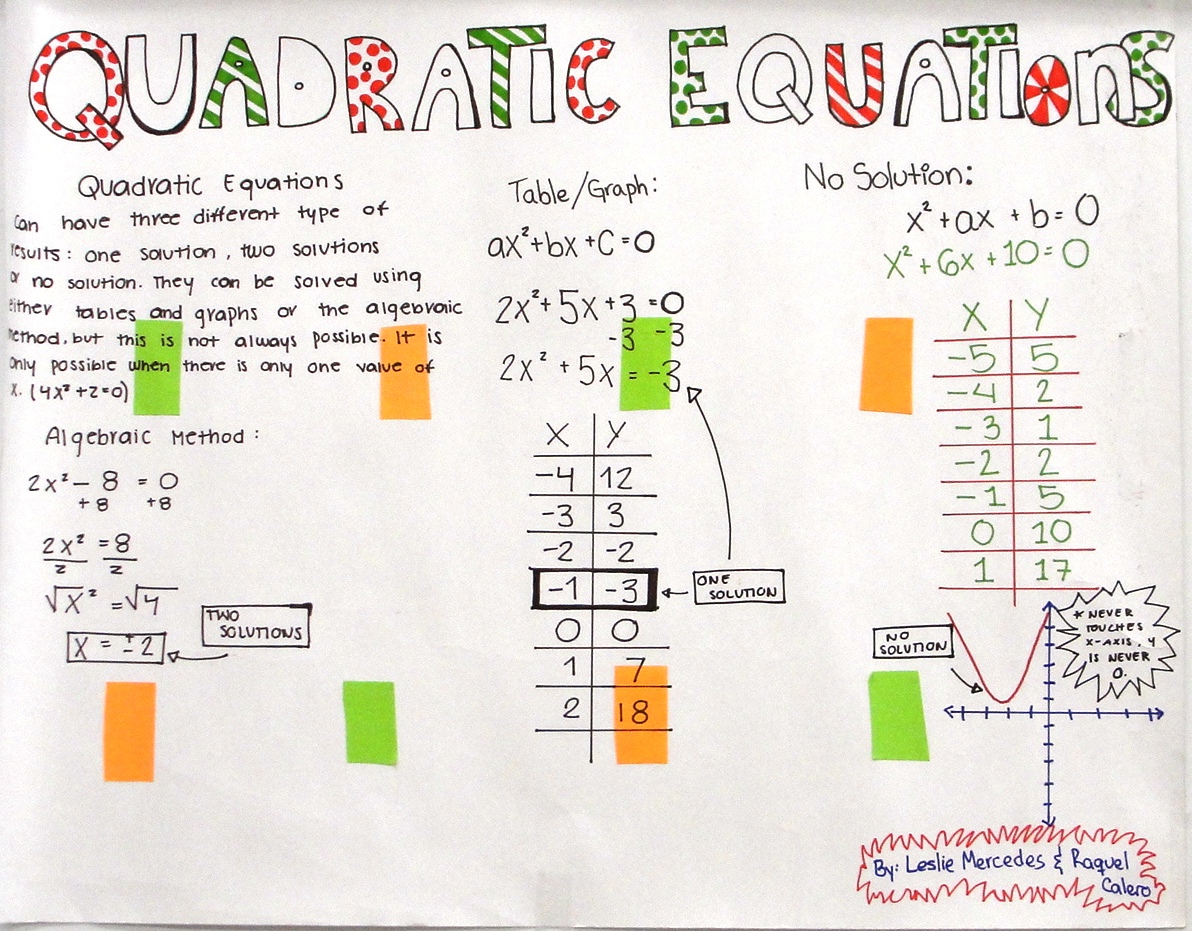
Chart from Rachid’s 10th grade Math class
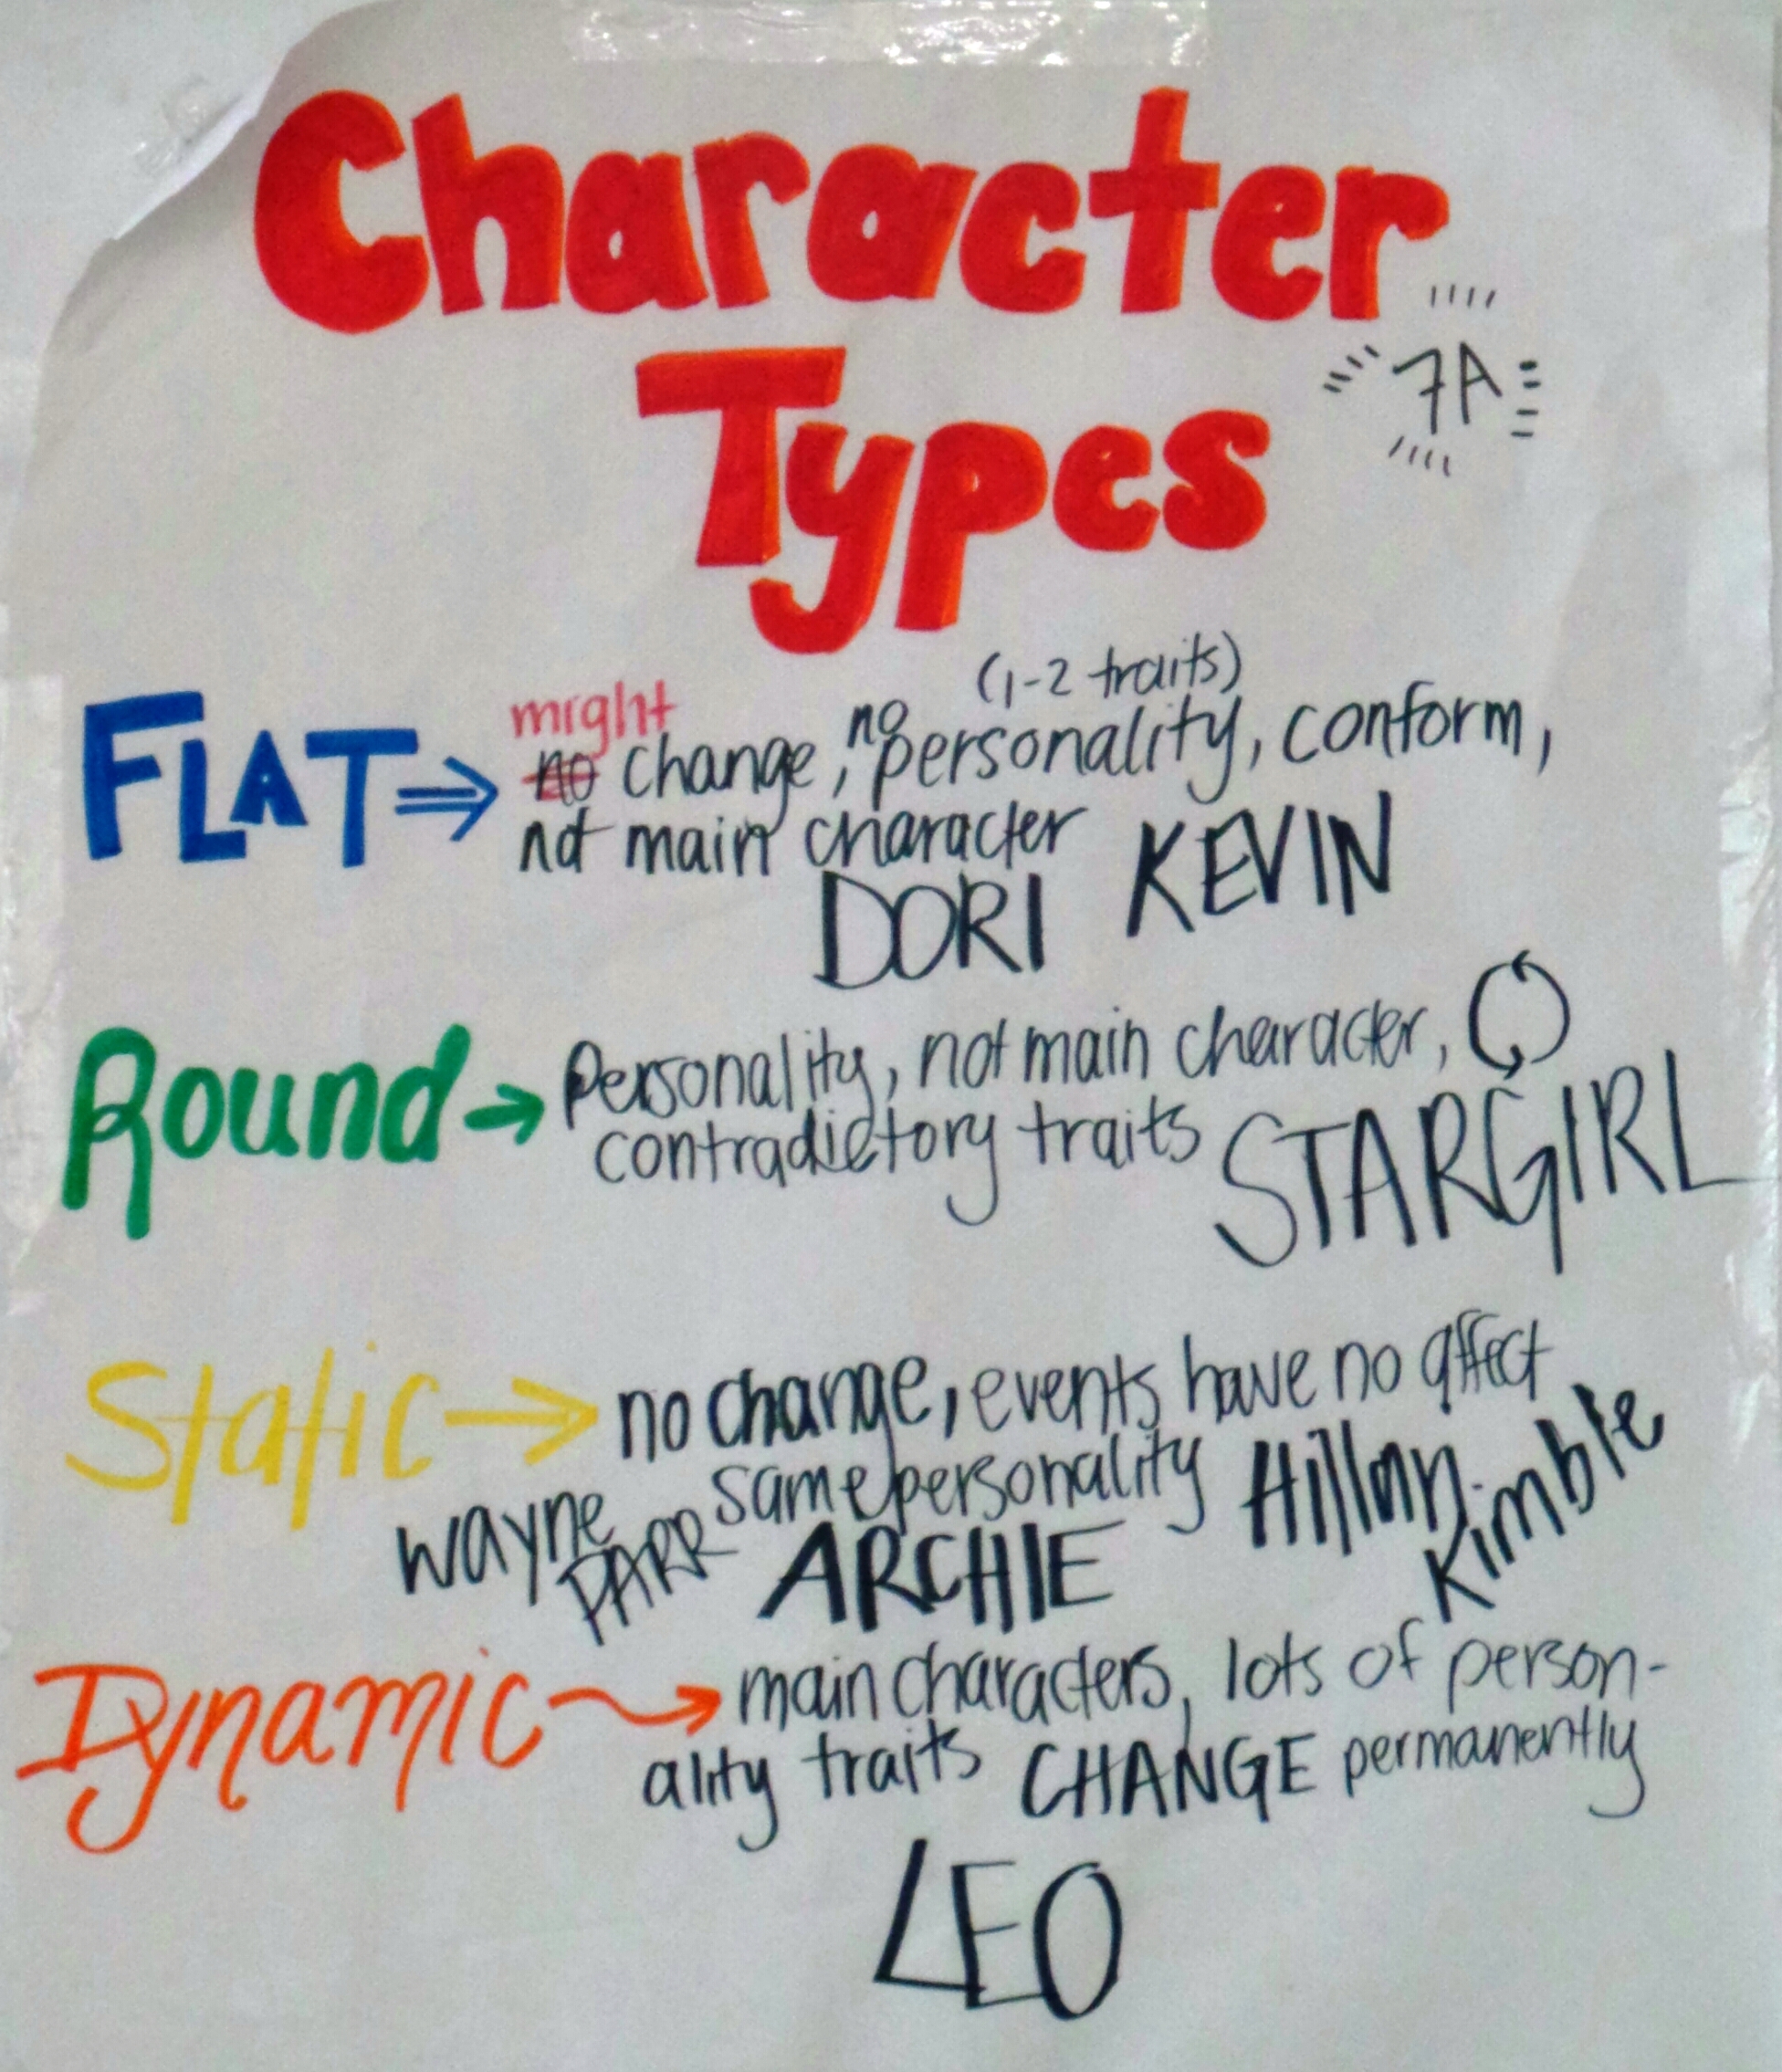
Anchor chart made during Danielle’s mini-lesson on character types.
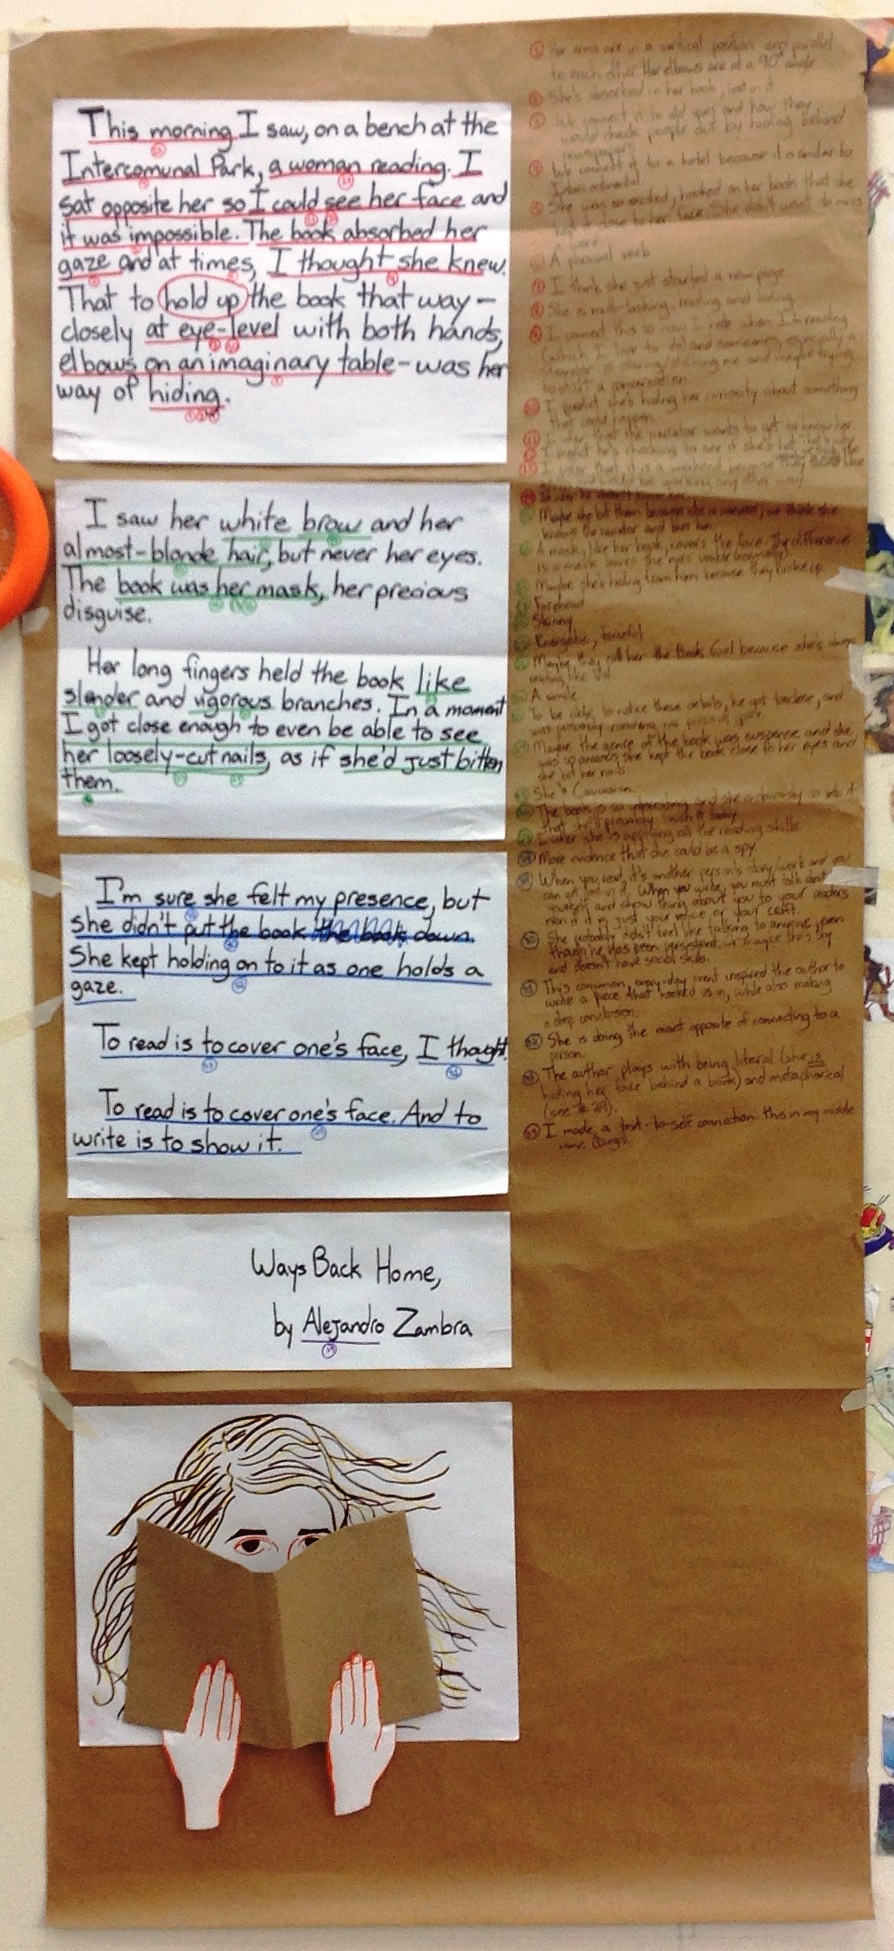
Valerie’s 6th grade literary analysis chart
Anchor charts are valuable teaching tools that should be used at all levels. However, if you try googling “anchor charts at the secondary level”, you won’t find much. Most of the examples come from elementary and middle school, but not much higher than that. If you’re a secondary teacher, don’t let the lack of examples stop you…..let the charts you find inspire you and then tweak them for your higher level content. Secondary students may be older, but they still deserve good teaching!
Check out my pinterest anchor chart board for lots of ideas:
pinterest: anchor charts
You can also find examples from TCFL in the following Flickr sets:
writing anchor charts
reading anchor charts
math anchor charts
Leave a comment